
Equity IRR is the internal rate of return on the cash flows to the equity investor, after interest and principal on the debt have been paid. It tells you what your money earns, not what the project earns.
In most models I review, it looks better than the deal deserves.
- Equity IRR is the internal rate of return on equity cash flows, after interest and principal on the debt.
- An inflated IRR is correct arithmetic on weak assumptions: price growth too steady, absorption too fast, no cost of equity, no schedule friction, no real downside.
- In the example, sales only six months later takes IRR from 25.1% to 21.2% while the multiple stays at 2.00x.
Equity IRR vs. project IRR
Project IRR (unlevered IRR) is calculated on the cash flows of the whole project, before any debt. It answers one question: is the asset itself any good?
Equity IRR (levered IRR) counts only the equity put in, after interest, principal and loan fees. It answers a different question: after using leverage, what does the person who wrote the equity cheque actually get?
The two numbers always diverge. If the asset earns more than the cost of debt, borrowing more lifts equity IRR. If the schedule slips or sales are slow, leverage makes equity IRR fall faster than project IRR does. A high equity IRR therefore says little about the quality of the deal. It says the assumptions and the capital structure are currently working in your favour.
What an inflated IRR looks like
An inflated IRR is correct arithmetic on weak assumptions. The spreadsheet never throws an error, because the formula is fine. The person building the model usually isn’t trying to mislead anyone. The drift happens when the assumptions are set.
Here are the five places I see it most often.
Price growth that is too steady and too high. Eight to ten percent a year, held for five to seven years, with no comparable evidence. Ask which data supports that rate, in that submarket, for that product type.
Absorption that runs on hope. Some models sell 80 to 90% of units within 12 to 18 months, before handover. Real absorption depends on approvals, construction progress and market liquidity, and nobody controls all three.
A missing cost of equity. Interest is charged on the bank loan. Equity, especially capital raised from outside investors, has an opportunity cost too. Leave it out and the IRR is overstated.
A construction timeline with no friction. No late permits, no delayed site clearance, no late completion sign-off. Every month of delay leaves capital tied up longer, and IRR falls faster than most people expect.
No real downside case. The base case is already the best case. The “downside” cuts the sale price by 5% and leaves everything else untouched. In a real downturn, lower prices come with slower sales and later completion, all at once.
An example: 28% down to 14%
I once reviewed a model that showed a 28% equity IRR.
I changed three things. I stretched the sales period by six months. I brought price growth back to something the market had actually delivered. I added a cost of equity.
The IRR came out at 14%.
Same land, same product. Only the assumptions changed.
An example: how IRR falls when assumptions get realistic
A hypothetical development, in billions. Equity invested is 60 in year 0 and 40 in year 1. Sales proceeds are 100 in year 3 and 100 in year 4. Total out 100, total in 200.
| Scenario | IRR | Multiple | Profit | NPV at 12% |
|---|---|---|---|---|
| Original | 25.1% | 2.00x | 100.0 | 39.0 |
| Sales six months later | 21.2% | 2.00x | 100.0 | 31.6 |
| Plus sale price 7% lower | 18.8% | 1.86x | 86.0 | 22.7 |
| Plus cost 5% higher | 17.2% | 1.77x | 81.0 | 17.9 |
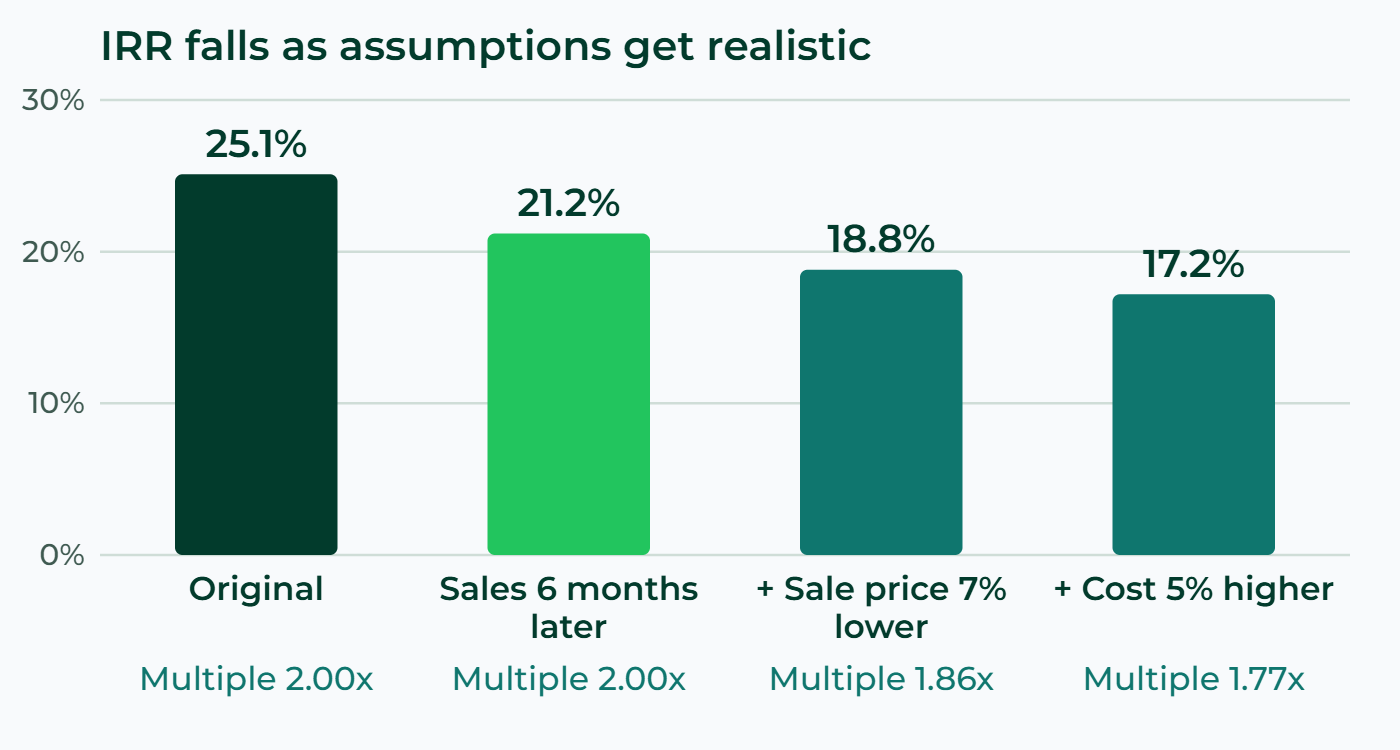
Three things to notice. One, sales only six months later takes IRR from 25.1% to 21.2% while the multiple stays at 2.00x. That is why IRR hides timing risk and the multiple hides duration. Two, three small adjustments together pull IRR down to 17.2%, more than a third lower than the original. Three, NPV at 12% falls from 39.0 to 17.9: still positive, but much thinner.
This is a small-scale version of what I saw in a real model: IRR showing 28% fell to 14% after three assumptions were corrected.
Calculating NPV and IRR for a project
NPV is the sum of the cash flows brought to present value at a discount rate you choose, usually your cost of capital or minimum required return. A positive NPV means the project earns more than that requirement.
IRR is the discount rate that makes NPV zero. In other words, it is the yield the project’s cash flows actually deliver.
In Excel, use XNPV and XIRR when cash flows have specific dates and are unevenly spaced, as in most developments. NPV tells you the absolute value left after paying the required return. IRR tells you the rate. Look at both, together with the multiple.
A 15-minute check
You do not need to rebuild a model to find out whether its IRR holds up.
- Find the price growth input and ask where the number came from.
- Slow the sales pace by six months and change nothing else. Note how far IRR falls.
- Add six months of construction delay. Note the second drop.
- Check whether the model charges a cost of equity anywhere.
- Run the three downsides together, not one at a time.
If IRR loses more than half its value after steps 2 and 3, the model is living on its assumptions, not on the asset.
Read IRR next to the other returns
Early in my career I judged deals by IRR alone. What I missed is that each metric exposes a different risk. IRR hides timing risk. Equity multiple shows how much capital actually comes back. DSCR shows whether cash flow can carry the debt without strain. Yield on cost shows the stabilised return on total cost.
One number gives you confidence. Four numbers give you clarity.
Frequently asked questions
What is equity IRR?
The internal rate of return on the cash flows to the equity investor, after interest and principal on the debt.
How is it different from project IRR?
Project IRR is calculated on the whole project’s cash flows before debt. Equity IRR counts only equity after debt. With leverage, the two diverge.
What is a hurdle IRR and where should it be set?
The minimum IRR you require to accept a deal. It should be compared with your real cost of capital at the time, not an old figure. This article quotes no level because it depends on the investor and the asset type.
Does a high IRR guarantee a good deal?
No. IRR can be high because of optimistic assumptions or a short hold while the capital multiple is low. Read it with the multiple, DSCR and yield on cost.
When should I use XIRR instead of IRR?
When cash flows have specific dates and uneven spacing. XIRR uses actual dates; IRR assumes evenly spaced periods.
References
Next step
If you have a deal and need an equity IRR that a lender or an LP will accept, you can see how CREFIC builds and reviews investment models and request sample models to look at the structure. Or send the deal details through the consultation form.
Which assumption do you see flattered most often in the models you review?
Have a deal to test?
Send the basics and we will tell you what a lender or investor would ask next.
Request a consultation